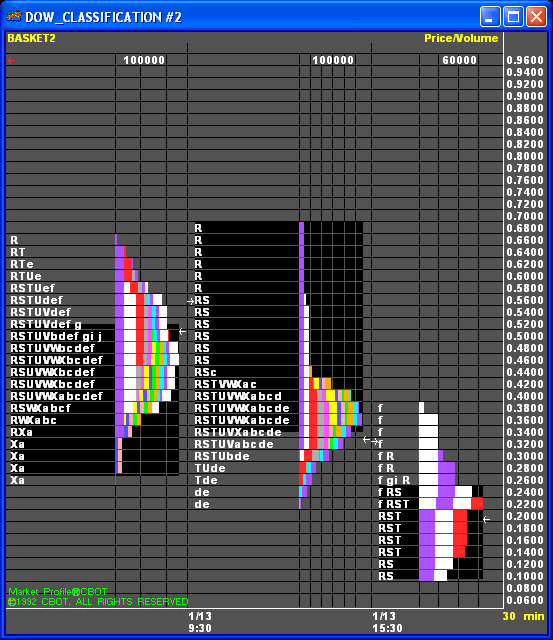
MP+ is available only by subscription. Contact Aspen Sales for more information.
Market Profile + (MP+) is part of Steidlmayer Software’s (SSI) "Capital Flow Software" program. SSI has licensed from the CBOT the right to use the name MP+, and SSI controls the re-licensing rights to this program. Aspen Research Group, Ltd. and Patsystems (PATS+) are approved vendors of this product.


Market Profile + does not employ a TPO color scheme.
In 1982, Peter Steidlmayer introduced Market Profile, a horizontal histogram of an instrument's daily range with a keen perspective on intraday price movement. Market Profile's initial scope was limited to intraday interpretation. This alone was sufficient to set Market Profile apart from other charting techniques. Market Profile shows range development a bar or candle cannot provide, giving a richer perspective on real-time price change.
MP+ applies the principles of Market Profile to the problem of assessing portfolio value real-time. While a familiarity with Market Profile helps in understanding MP+, there are some important differences you should note:
Where Market Profile is bound by the temporal schedule of an individual instrument, MP+ is not.
Where Market Profile is designed to analyze the price movement of a single instrument, MP+ is designed to study the composite value of a portfolio.
The MP+ Y axis scale represents the profitability of a position rather than the price of an instrument.
Boundaries
MP+ is designed to study holding behavior by analyzing a position, which today typically consists of many long and/or short positions in several, often different, instruments. MP+ poses no constraints on the composition of a position. A position may consist of futures, stocks, currency cross-rates, mortgage backed securities, or all of the above, and more. Think of a position as a composite instrument, or X Fund.
You define constituent members of a position as a basket using Aspen's Baskets menu. To display the Baskets menu, select Baskets in the Market Profile menu. The Basket menu enables you to combine your holdings in a single instrument.
Market Profile was designed to study an instrument's intraday trading activity within a daily scope. As a chart of a single instrument, Market Profile's starting and ending points are instrument's open and close. By contrast, MP+'s starting and ending points of MP+ are a function of a composite instrument's value. MP+ has three governing properties:
Minimum
Break Points
Days History
The Minimum parameter defines the minimum number of half hour periods for each plot. Once the minimum number of periods has been attained, MP+ applies the Break Points property. If the value of the position has moved away (up or down) from the opening by the number of Break Points, MP+ commences a new plot. The Minimum and Break Points properties default to 12 and 9, respectively. (The Days History properties defines the number of days of thirty minute bar data to analyze; the default is 20.)
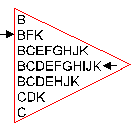
MP+ is designed to reveal holding behavior, so the Minimum and Break Points properties must be applied thoughtfully, with particular consideration of the instruments comprising a basket. Holding behavior is revealed by pennant forms (typical of a Market Profile Non-Trend Day):

Once the plot contains the number of periods specified in the Minimum property, MP+ evaluates variation from the opening value using the Break Points property. The pennant form indicates stable inventories. Variation from a pennant form indicates liquidation.
Composite Instruments
Nowadays, Market professionals increasingly rely on complex positions to enhance performance. Today's trading world offers products and derivatives with sound clearing facilities while OTC markets offer products with fewer services. MP+ allows you to create custom products from the larger set of exchange and OTC products. As mentioned above, your custom products can include stocks, cash products, commodities and other instruments you feel will enhance your control and results.
Scale
More than anything else, the x axis scale differentiates MP+ from its predecessor. Where Market Profile's x axis scale consists of an instrument's prices, MP+'s x axis scale reveals the profitability of position. The "last price" of MP+ may represent the profitability of a position in single instrument, but MP+ is designed to give you the big picture of a larger, more complex portfolio.
The first thing you should notice about the x axis scale is that it typically comprises positive and negative values. As a function of portfolio value, the last "price" of MP+ represents the value of a position, positive or negative.
©2008 Aspen Research Group, Ltd. All rights reserved. Terms of Use.