![]()
![]()
|
|
|
|
|
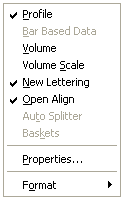
Selection |
Function |
|
Profile |
Toggles Market Profile.
If checked, Market Profile is displayed.
|
|
Bar Based Data |
See Market Profile +
|
|
Volume |
Toggles Spectrum Profile.
If checked, Spectrum Profile is displayed. The Spectrum Profile displays the tick volume at each price. There is no extra charge for using Spectrum Profile.
|
|
Volume Scale |
Toggles Volume Scale.
If checked, Spectrum Profiles is displayed on a grid. At the top of each Spectrum Profile grid, you see a number. This number provides scale for interpreting tick volume.
|
|
New Lettering |
Toggles the use of the CBOT TPO scheme.
If checked, CBOT TPOs are displayed. If not checked, traditional TPOs are displayed.
|
|
Open Align |
Toggles Market Alignment
If checked, Market Profile is aligned to the opening of the instrument. If not checked, Market Profile is aligned to the half-hour.
By default, Market Profiles are aligned on the half-hour. If you use the default alignment to display the U. S. Bond contract in a 30-minute time base, the first TPO represents 10 minutes of trading.
Alternatively, you can align the U. S. Bond Market Profile to the opening bell. Using the Open Aligned option, the first period will start at 7:20 CST and end at 7:50, the second period will start at 7:50 and end at 8:20, and so on.
|
|
Auto Splitter |
See Market Profile +
|
|
Baskets |
See Market Profile +
|
|
Properties... |
Displays the Profile Properties dialog. |