|
|

|
Selection |
Function |
|
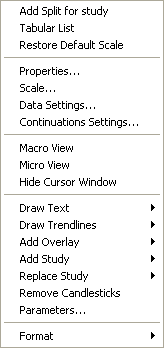
Add Split for study |
Removes any custom scaling from the time and/or price scale.
|
|
Tabular List |
Splits the chart window. A split window enables you to display studies that scale differently than the instrumentís prices. Splitting allows you to share the time scale, but not the price scale.
|
|
Restore Default Scale |
Adds a window to the screen that shows a table of the data in the chart window.
|
|
Properties... |
Displays the Chart Properties dialog's general tab.
|
|
Scale... |
Displays the Chart Properties dialogís Scale tab.
Price scale options are mutually exclusive.
The time base of a chart is defined by a width and a length. You can set the width to any of the following:
Depending on the width you choose, the length field's label changes. For example, if you choose Minute, the length fieldís label changes to 'Minutes', as shown in the figure above. Similarly, if you choose Multi-Day, the label changes to 'Day'
|
|
Data Settings... |
Displays the Chart Properties dialog's Data tab.
|
|
Continuation Settings... |
Displays the Chart Properties dialog's Continuations tab.
|
|
Macro View |
Expands the time scale.
|
|
Micro View |
Compresses the time scale.
|
|
Hide Cursor Window |
Removes the chart cursor and cursor window from the chart.
|
|
Draw Text |
Displays the Text menu.
|
|
Draw Trendlines |
Displays the Trend Lines menu.
|
|
Add Overlay |
The Add Overlay selection displays the following list of available overlay studies.
DeMark Overlay and Kase Overlay are enabled only by subscription to the respective Aspen entitlements.
Formula Overlay is disabled unless you have written a study designed for use as an overlay study.
|
|
Add Study |
Choosing a study from this menu adds the study to the active chart or split chart window.
Formula Study is disabled unless you have written a study designed for use as an conventional study.
|
|
Replace Study |
Choosing a study from the cascading menu replaces the study in the active window with the study you select.
|
|
Remove |
There may be up to two Remove selections, depending on the content of the active chart window. A Remove menu displays a list of studies or overlays in the active chart or split window. Selecting any study or overlay in the list removes the element from the active chart or split window. The following figure shows the content of the Remove Study/Overlay menu when the active window contains a bar chart and a moving average.
|
|
Parameters |
The Parameters selection displays a list of studies or overlays in the active chart or split window. Selecting an element in the list displays the parameters menu for the element. The following figure shows the content of the Parameters menu when the active window contains a bar chart and a moving average.
Parameters menus vary from element to element. Study and overlay parameters typically include number of periods, price, line style and color.
|
|
Format |
see Font Adjustment |
©2008 Aspen Research Group, Ltd. All rights reserved. Terms of Use.