|
|

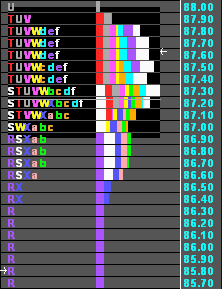
The Spectrum Profile is a histogram that shows the number of ticks at each price within an instrument's trading range. A horizontal bar is drawn at each price level. The total length of this bar reflects the total number of ticks at a price. Each bar is further divided into colored segments (Spectra). Each color segment relates to the color assigned to a particular TPO.
Spectrum Profiles is best used in conjunction with the Market Profile. Further, it is often helpful to view Spectrum Profile with volume scaling. The Market Profile provides a “key” to the colors of the Spectrum Profile.
©2008 Aspen Research Group, Ltd. All rights reserved. Terms of Use.