![]()
|
|
|
|
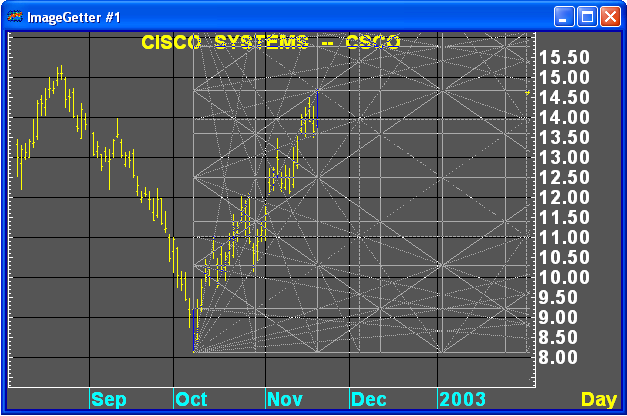
A Gann square is a method of forecasting future support or resistance levels by counting forward from the all-time low or high price of an instrument. The all-time low or high price serves as an origin point. Each higher price increment is entered in a grid organized in a clockwise manner around the origin point, beginning one place to the left of the origin. The resulting formation resembles a square, the x and y axes of which are known as the cardinal-cross.
To draw Gann Squares, click  , or choose Gann Square from
the Trend Lines menu. Gann Square is drawn according to the parameters
set in the Gann's Square
Options dialog.
, or choose Gann Square from
the Trend Lines menu. Gann Square is drawn according to the parameters
set in the Gann's Square
Options dialog.
Higher price increments that fall in the cardinal-cross are, according to Gann, the most likely future support or resistance levels. When you plot Gann Squares on a chart, the geometric formations can determine significant support and resistance levels.
©2008 Aspen Research Group, Ltd. All rights reserved. Terms of Use.