|
|
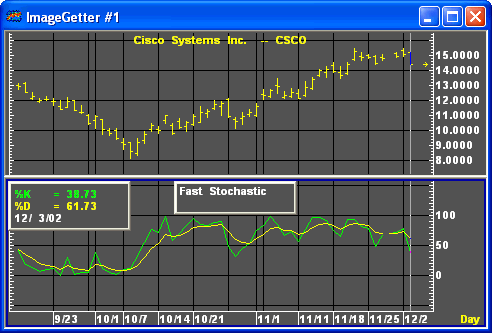
Two lines make up a stochastic study: %K and %D. These lines oscillate on a vertical scale between 0 and 100. A divergence between the %D line and the price of the underlying instrument produces a signal. A divergence below 15 is commonly thought of as a signal to buy. A divergence above 85 is commonly thought of as a signal to sell.

Formula:

F%D = 3 period modified moving average of F%K
Where:
F%K = fast %K
F%D = fast %D
Fast stochastics are initially calculated by starting with the left-most bar in a range. Fast %K is calculated by subtracting the lowest low from the current close, dividing the difference by the difference of the highest high less the lowest low, and multiplying the quotient by 100. The %D line is a 3 period modified moving average of the %K line.

|
Parameter |
Function | ||||||||||||||
|
Color |
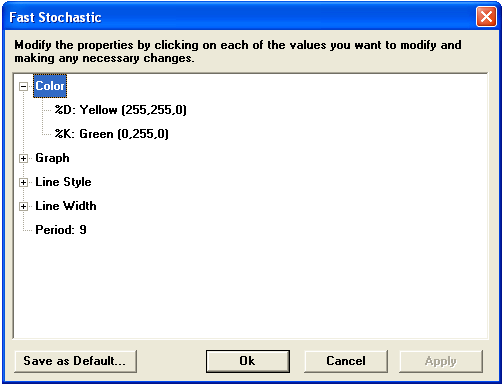
Default color for %D is yellow. Default color for %K is green. To change the color, click on the color button:
Then choose the color you want from the Color Menu.
| ||||||||||||||
|
Graph |
Sets the drawing method for the study.
| ||||||||||||||
|
Line Style |
Sets the rendering technique of the graph parameter (if it is set to Line).
| ||||||||||||||
|
Line Width |
Sets the tickness of the study line.
| ||||||||||||||
|
Period |
Default is 9 |
Notes
See, notes on the Slow Stochastic.
see, George C. Lane, "Lane Stochastics," in Technical Analysis of Stocks and Commodities, May/June, 1984; see also, Murphy, John J., Technical Analysis of the Futures Markets, A Comprehensive Guide to Trading Methods and Applications, New York: New York Institute of Finance, A Prentice-Hall Company, 1986, p. 304-309.