|
|
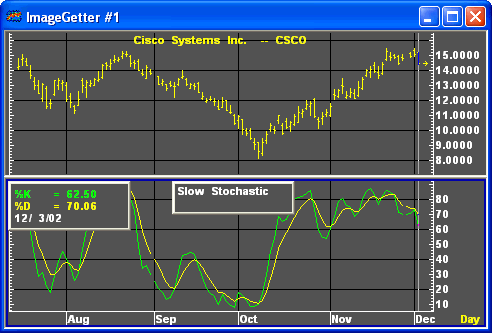
The slow stochastic is a smoothed variation of the fast stochastic. The slow stochastic is more commonly used and is often referred to as the stochastic. The slow stochastic draws buy and sell signals the same way fast stochastics do--all rules apply.

Formula:

F%D = 3 period modified moving average of F%K
S%K = F%D
S%D = 3 period modified moving average of S%K
Where:
F%K = current fast %K
F%D = current fast %D
S%K = current slow %K
S%D = current slow %D

|
Parameter |
Function | ||||||||||||||
|
Color |
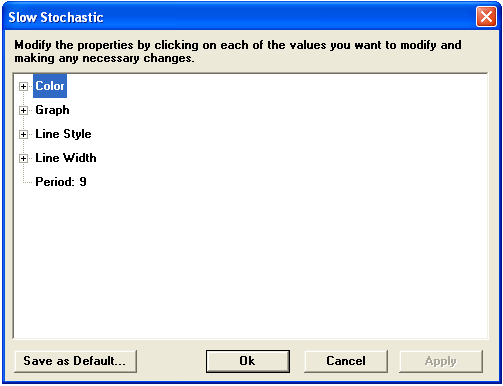
Default color for %D is yellow; %K defaults to green. To change the color, click on the color button:
Then choose the color you want from the Color Menu.
| ||||||||||||||
|
Graph |
Sets the drawing method for the study.
| ||||||||||||||
|
Line Style |
Sets the rendering technique of the graph parameter (if it is set to Line).
| ||||||||||||||
|
Line Width |
Sets the tickness of the study line.
| ||||||||||||||
|
Period |
|
Notes
Developed by George C. Lane in the late 1950s, the Slow Stochastic is a momentum indicator that plots between 0 and 100. The Stochastic value shows the location of the current close relative to the high/low range over a selected number of periods. Closing levels that are consistently near the top of the range indicate accumulation (buying pressure) and those near the bottom of the range indicate distribution (selling pressure).
Readings below 20 are considered oversold and readings above 80 are considered overbought. However, Lane did not believe that a reading above 80 was necessarily bearish or a reading below 20 bullish. A security can continue to rise after the Stochastic Oscillator has reached 80 and continue to fall after the Stochastic Oscillator has reached 20. Lane believed that some of the best signals occurred when the oscillator moved from overbought territory back below 80 and from oversold territory back above 20.
Buy and sell signals can also be given when %K crosses above or below %D. However, crossover signals are quite frequent and can result in a lot of whipsaws.
One of the most reliable signals is to wait for a divergence to develop from overbought or oversold levels. Once the oscillator reaches overbought levels, wait for a negative divergence to develop and then a cross below 80. This usually requires a double dip below 80, the second dip being the bearish signal.
For a bullish signal, wait for a positive divergence to develop after the indicator moves below 20. Disregard the first break above 20. After the positive divergence forms, the second break above 20 is bullish.
see, George C. Lane, "Lane’s Stochastics," in Technical Analysis of Stocks & Commodities, May/June, 1984; see also, Murphy, John J., Technical Analysis of the Futures Markets, A Comprehensive Guide to Trading Methods and Applications, New York: New York Institute of Finance, A Prentice-Hall Company, 1986, p. 309.