|
|
To draw Absolute Retracement, click ![]() , or choose TD Abs
Retracement from the Trend Lines Menu.
, or choose TD Abs
Retracement from the Trend Lines Menu.
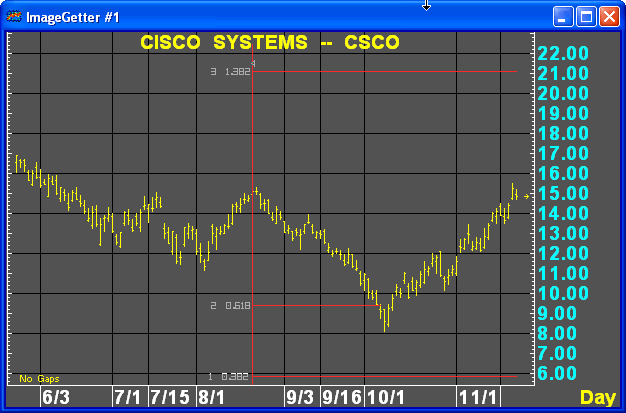
Absolute Retracement is applied once a market's price advance is at an all-time high or low. Consequently, Relative Retracement cannot be used since there exists no reference point historically. Absolute Retracement is applied to the high bar/low bar. Retracement ratios will be displayed to the downside/upside and can be used as support levels/resistance levels.

The Absolute Retracement study is an Aspen trendline draw function. Selecting TD Absolute Retracement from the Trendline Functions menu prepares the trendline cursor to draw the Absolute Retracement. Clicking on a bar in the chart defines an anchor point, or reference bar, for the retracement. The retracement lines can be modified or deleted in the same way as other Aspen trendlines, and their respective retracement levels are available in the cursor window.
A click is assumed to refer to the high, low, open, or close of a displayed bar; the software locates the nearest such point and uses it as the exact reference point. To be more precise, the software first finds the horizontally nearest bar column, then chooses the vertically closest reference point within that column. If multiple data items are on display, the one with the vertically closest reference point is chosen. (Formula data items are not eligible to be chosen.) Only high and low points are eligible.
For further information on Absolute Retracement, please refer to Thomas R. DeMark, The New Science of Technical Analysis, New York: John Wiley & Sons, 1994, Chapter 2.
Parameters
The Absolute Retracement study also has Date and Time parameters, which identify the date and time of the reference bar. As with any trend line drawing function, the process of drawing a Absolute Retracement study involves selecting a reference bar, and selection specifies the Date and Time parameters.

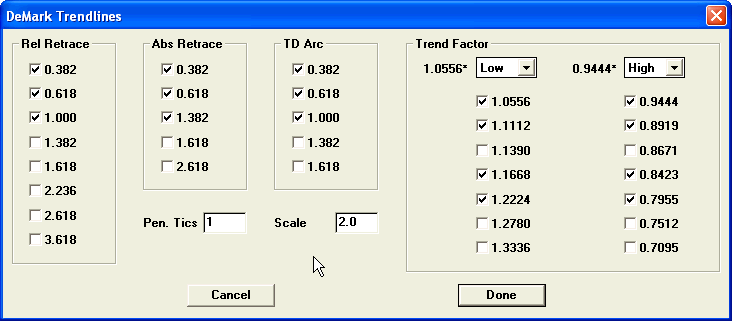
The Absolute Retracement is similar to the Relative Retracement study except that no search for a prior high/low occurs; instead, the retracement lines are drawn at absolute multiples of the anchor price. Allowable multiples are 0.382, 0.618, 1.382, 1.618, and 2.618. All else is the same as relative retracement.