|
|
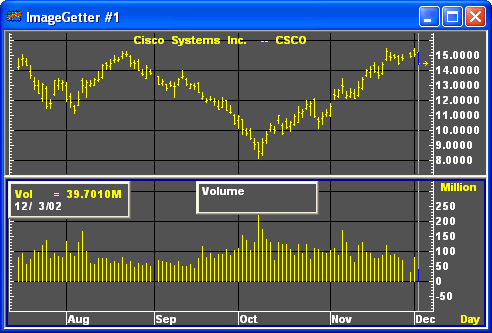
Volume studies are available only on daily and weekly charts. Volume is the number of shares or contracts traded in a given time period.

A volume study measures the intensity of a price move. Volume ordinarily reacts to the direction of a price trend. In an uptrend, volume should increase as prices rise; in a downtrend, volume decreases as prices fall. Divergence is commonly interpreted as a signal of a possible trend reversal.

|
Parameter |
Function | ||||||||||||||
|
Color |
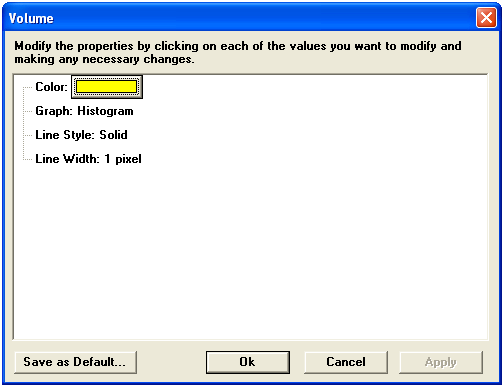
Default color is yellow. To change the color, click on the color button:
Then choose the color you want from the Color Menu.
| ||||||||||||||
|
Graph |
Sets the drawing method for the study.
| ||||||||||||||
|
Line Style |
Sets the rendering technique of the graph parameter (if it is set to Line).
| ||||||||||||||
|
Line Width |
Sets the tickness of the study line.
|