![]()
|
|
|
|
The trend line is an old and popular chart analysis tool. Aspen Graphics' powerful trend line drawing capabilities, combined with features such as time shift and logarithmic scaling, provide a strong foundation for trend identification.
The uses of trend lines are many and varied. Many books have been written about trend lines and geometric chart formations. Many of these formations are easily constructed in Aspen Graphics. Some of the simplest applications of trend lines include:
Horizontal Support and Resistance
Support is a level or area on a chart under the market where buying interest overcomes selling pressure. Resistance is the opposite of support: that is, a price level or area over the market where selling pressure overcomes buying pressure.
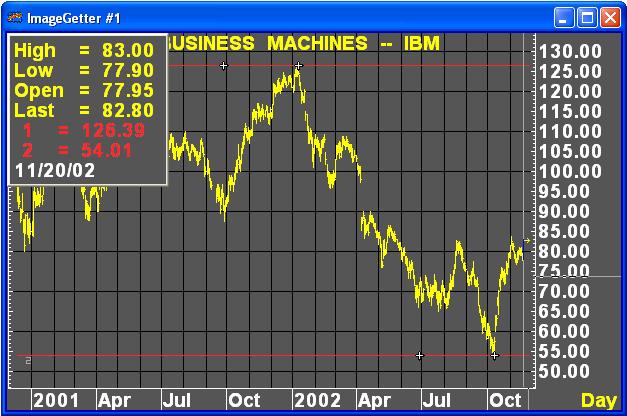
see, John J. Murphy, Technical Analysis of the Futures Markets, A Comprehensive Guide to Trading Methods and Applications, New York: New York Institute of Finance, A Prentice-Hall Company, 1986, p. 59.
A bullish support line is drawn under rising lows. A popular application of bullish support lines involves connecting two successively high lows to form a test. A third low that falls on the line confirms support. Subsequent penetration of an established support line is commonly thought of as a signal to change to a down trend.
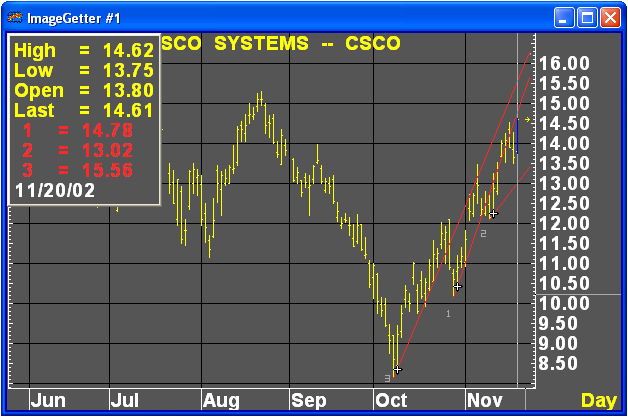
see, John J. Murphy, Technical Analysis of the Futures Markets, A Comprehensive Guide to Trading Methods and Applications, New York: New York Institute of Finance, A Prentice-Hall Company, 1986, p. 68.
A bearish resistance line is drawn above falling highs. A popular application of bearish resistance lines involves connecting two successively lower highs to form a test. A third high that falls at or below the line confirms resistance. Subsequent penetration of the line is commonly thought of as a possible reversal.
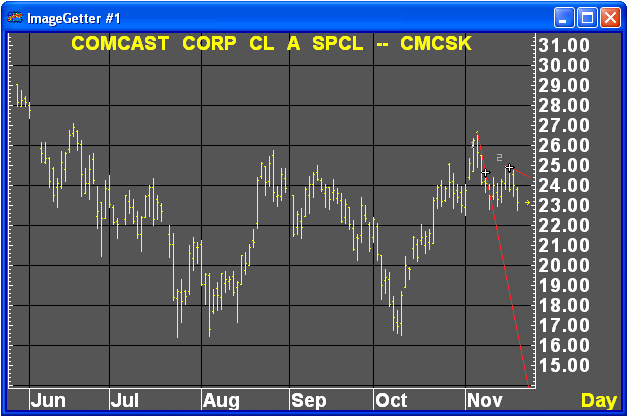
see, John J. Murphy, Technical Analysis of the Futures Markets, A Comprehensive Guide to Trading Methods and Applications, New York: New York Institute of Finance, A Prentice-Hall Company, 1986, p. 69.
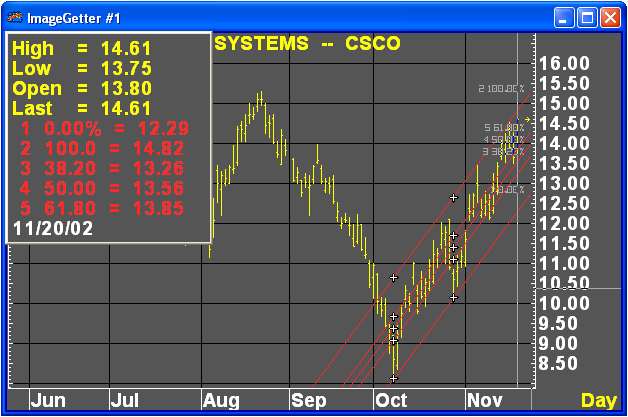
While basic trend signals generated by penetration of support and resistance lines are often sufficient, you can account for small penetrations by establishing a band, or zone of commitment, to your trend line. Bands are simply trend lines drawn parallel to the main trend line.
Parallel lines are often used to define price channels. For example, once you draw a bullish support line, you then add a parallel line through a significant high in the trend. You might then expect prices to fluctuate within the resulting channel.
Aspen Graphics lets you draw two types of parallel lines: parallel and linked-parallel lines. A parallel line is initially drawn parallel to the main trend line; however, the parallel line is independent of the main trend line, so you can pivot and extend it without affecting the main trend line. By contrast, a linked parallel line is also drawn parallel to the main trend line, but it is also linked to the main trend line so that if you manipulate either line, both lines are affected.