|
|
When there are many trend lines on a chart, note that the cursor window displays only one of the trend lines. You control which trend line is displayed in the cursor window by positioning the mouse pointer on or near the trend line you want displayed. Then, hold down the right mouse key and click the left mouse key.
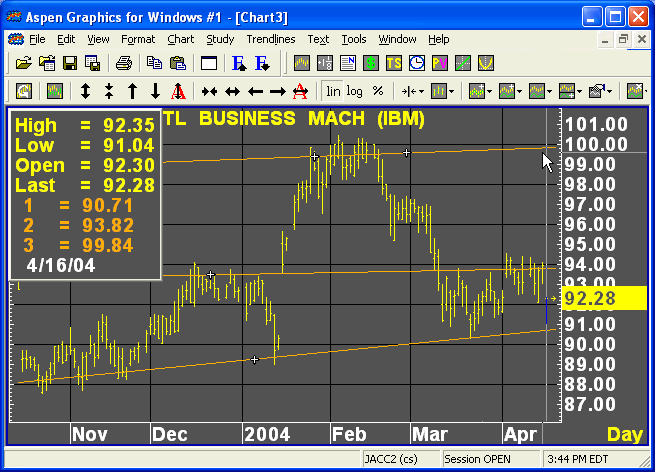
In the image below, note the location of the mouse pointer, and the content of the cursor window. The price level of all three trend lines are displayed in the cursor window:

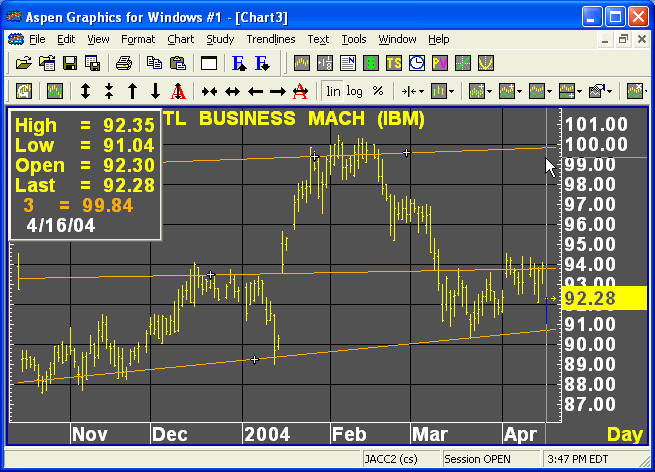
By holding the right mouse key down and clicking the left, the content of the cursor window changes to show the price level of the trend line nearest the mouse pointer:

©2008 Aspen Research Group, Ltd. All rights reserved. Terms of Use.