|
|
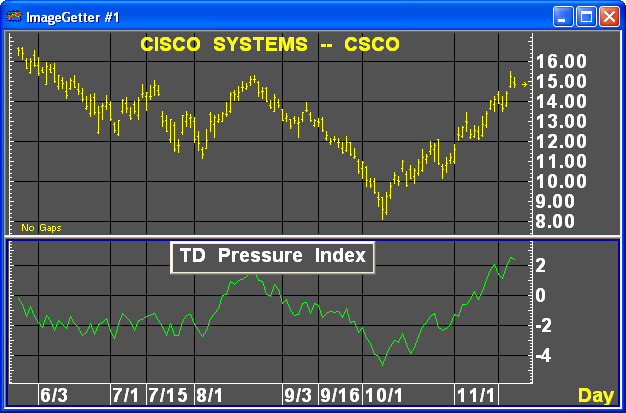
TD Pressure measures the degree of accumulation (buying) and of distribution (selling). TD Pressure is represented by a line or histogram displaying the cumulative index of buying and selling, The formula combines price activity and volume and their relationship with the previous bar's open, high, low, and close.

For further information on TD Pressure, please refer to Thomas R. DeMark, The New Science of Technical Analysis, New York: John Wiley & Sons, 1994, Chapter 5, Accumulation Distribution.
Parameters
This study draws a graph of accumulation/distribution pressure. Optionally, dotted reference lines can be drawn at user-set values, but these lines do not affect the calculation or display of the TDPRS line itself.

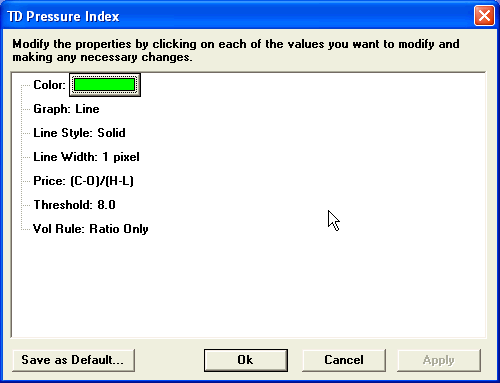
At each bar, TDPRS computes a price ratio and then optionally multiplies this by the volume. Several different price ratios are available:
(Close - Open)/(High - Low)(default)
(Close - Prior Close)/(High - Low)
Close - Open
Close - Prior_Close
Different calculation is applied if the opening price is more than a threshold percentage away from the prior close. If Open is more than P% greater than the prior close, then instead compute:
((Close - Prior Close)+(Close - Low))/(High - Prior Close)
In either case, the result is optionally multiplied by volume.
TDPRS outputs a gap at any gap bar, but gap bars are ignored in looking back to find the prior close value.
The study command for Pressure is .TDPRS.