![]()
![]()
|
|
|
|
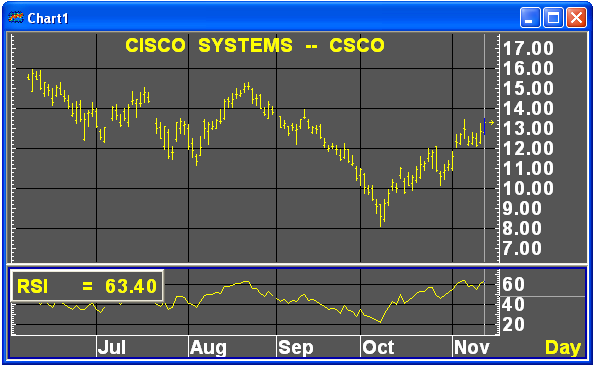
A split window is designed to plot a conventional study. A conventional study produces values that do not correspond to an instrument's price. While the split allows different price, or value scales, the time base is shared.
To split a chart window, choose 'Add split for study' from the Chart
Menu, or click the Split Chart button  in the tool bar.

The size of the split window is adjustable. To size the split window, position the pointer over the border between the bar chart and the study. When the pointer changes to a sizing tool, left click and drag the border to size.
©2008 Aspen Research Group, Ltd. All rights reserved. Terms of Use.