![]()
![]()
|
|
|
|
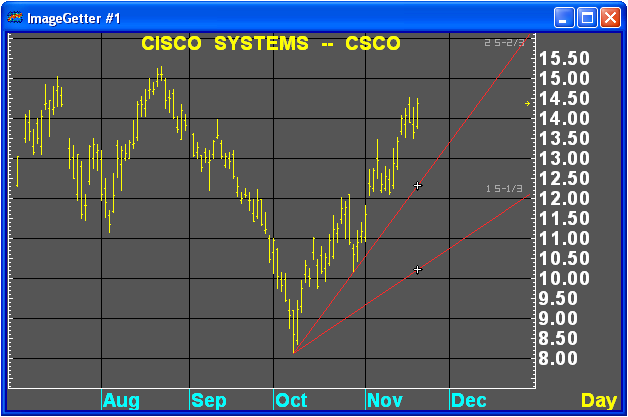
Speed lines are a method of trend identification that utilizes the idea of dividing a trend into thirds. Speed lines help identify the rate of ascent or descent of a trend (e.g., its speed).
To draw speed lines, follow these steps:
Identify the origin of a trend and the highest
or lowest point of the trend.
Click  , or select Speed Lines from
the Trend Lines menu.
, or select Speed Lines from
the Trend Lines menu.
Clicking the left mouse key on the origin point
of the trend.
Drag the pencil to the highest or lowest point
in the trend.
A horizontal line appears as you move the cursor.
Left-click on the termination point of the trend to draw the speed lines.
To construct a bullish speed line, you need to identify the origin price of the up trend and the highest price of the up trend. The speed line function connects these two points with a vertical line and divides the resulting vertical line into thirds, rendering trend lines from the origin point through the resulting thirds.
The converse of this process draws a bearish speed line.
Each time a new high is set in an up trend or a new low is set in a downtrend, you need to adjust your speed lines.
Theoretically, if a trend is correcting itself, it will usually stop at the 2/3 speed line. If not, prices will seek out the 1/3 speed line. If the 1/3 line is also broken, prices may continue to seek the origin level of the trend. Trends reverse if the origin level is broken.
©2008 Aspen Research Group, Ltd. All rights reserved. Terms of Use.