|
|
The Relative Strength Index is an overbought/oversold indicator plotted on a vertical scale from 0 to 100. Developed by J. Welles Wilder, the RSI originally employed a fourteen-period calculation. Wilder considered RSI values under 30 as oversold conditions, and RSI values over 70 as overbought conditions. Now, five-to fourteen-period calculations are commonly applied, depending on the market, and 80 and 20 are often used to delineate overbought and oversold conditions, respectively.

Formula:

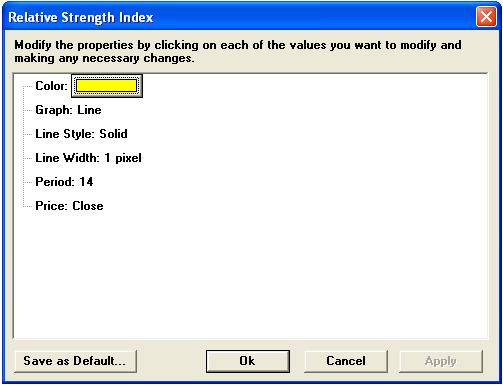
You change the number of periods used to calculate the RSI in the RSI Parameters menu. A low number of periods yields frequent buy and sell signals. A high number of periods yields fewer buy and sell signals.

|
Parameter |
Function | ||||||||||||||||||
|
Color |
Default color is yellow. To change the color, click on the color button:
Then choose the color you want from the Color Menu.
| ||||||||||||||||||
|
Graph |
Sets the drawing method for the study.
| ||||||||||||||||||
|
Line Style |
Sets the rendering technique of the graph parameter (if it is set to Line).
| ||||||||||||||||||
|
Line Width |
Sets the tickness of the study line.
| ||||||||||||||||||
|
Period |
| ||||||||||||||||||
|
Price |
The price on which the study is calculated:
|
Notes
Developed by J. Welles Wilder, the Relative Strength Index (RSI) remains a popular, much-used momentum oscillator. The RSI compares gains to losses to calculate a value between 0 to 100. Wilder recommended using a 14 period RSI based on the close, but the number of periods and operative price parameters are adjustable in Aspen.
RSI is a banded oscillator. Wilder also recommended using 70 and 30 and overbought and oversold levels, respectively. As the RSI falls below 30, overbought conditions exist. Rising from below 30 to above 30 is considered bullish. Conversely, as the RSI rises above 70, overbought conditions exist, and falling back below 70 is considered bearish.
Buy and sell signals can also be generated by divergence.
The centerline for RSI is 50. Generally, a reading above 50 indicates dominant buying, below 50 dominant selling.
see, J. Welles Wilder Jr., New Concepts in Technical Trading Systems, McLeansville, NC: Trend Research, 1978, pp. 63-70.