|
|
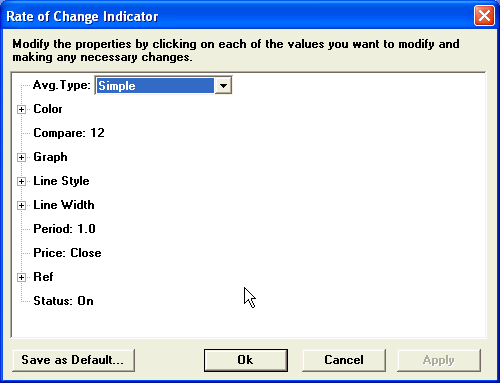
The Rate of Change study identifies overbought/oversold conditions by simply comparing current price activity to some period earlier.

Parameters
This study draws a graph of rate-of-change values, which fluctuate around 1.0. Optionally, dotted reference lines can be drawn at user-set values, but these lines do not affect the calculation or display of the ROC line itself.

The basic ROC calculation at any given bar is:
Price/Price[K bars ago]
where the price examined is selectable (default is close), as is the distance X. The final study value is an N-bar moving average of this value.
The study command for ROC is .TDROC.