|
|
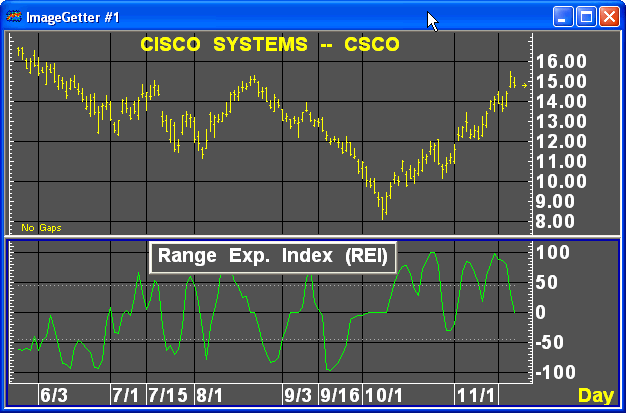
The Range Expansion Index (REI™) identifies areas of price exhaustion generally associated with price peaks and troughs. This indicator is selective in the sense that it compares current price activity with recent price movement, but it ignores breakaway price moves until its steepness begins to dissipate. For better results, if the number of bars outside the band is 5 or fewer, a potential top or bottom has been formed. Generally. this is confirmed once a down/up close versus the previous day's bar is recorded.

For further information on Range Expansion Indicator, please refer to Thomas R. DeMark, The New Science of Technical Analysis, New York: John Wiley & Sons, 1994, Chapter 3, Overbought/Oversold.
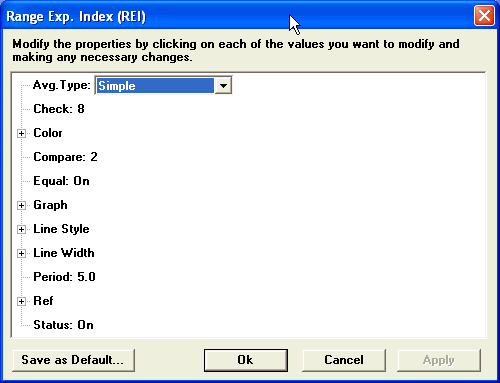
Parameters
The Range Expansion Indicator will turn from black to white when it moves from an oversold to an overbought zone; it turns blue when it moves back to an oversold zone.

This study draws a graph of range expansion values, which fluctuate between +100 and -100. It would typically be drawn in its own chart sub-window. Optionally, dotted reference lines can be drawn at user-set values, but these lines do not affect the calculation or display of the REI line itself.