|
|
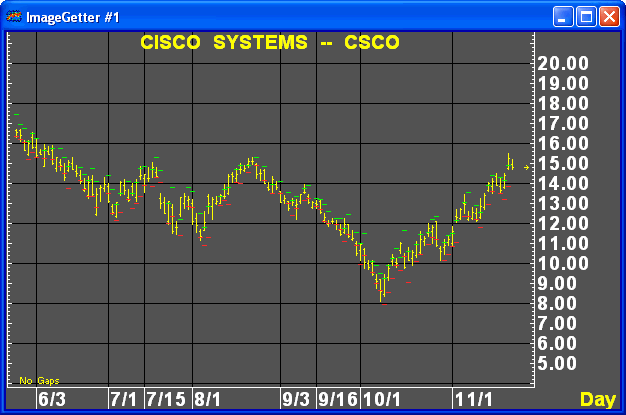
This study identifies high and low breakout values for the next bar of a series. A short horizontal line is drawn at the projected breakout high and low. The default chart position will shift left a bar when this study is active.

The projections for a bar are based on the price activity immediately preceding bar or series of bars.
The price is the previous bar's close, or current bar's open (or other user-selectable price). The range is either the previous bar or series of bars. The factor is user-selected.
The user may compute and draw projections for all bars or for only the current and succeeding bars. The study command for Range Expansion BreakOut is .TDREBO.
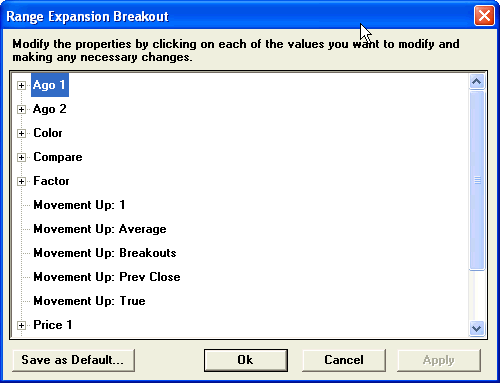
Parameters
