|
|

|
Parameter |
Function | ||||||||
|
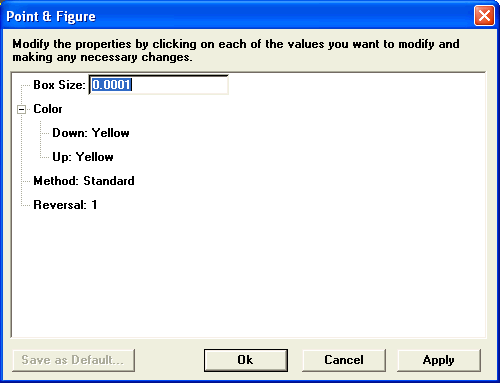
Box Size |
Enables you to define the Box Size of the Point & Figure plot.
The box size is the minimum price change plotted in a Point & Figure chart. In other words, if an instrument's price changes by an amount less than the box size, no plot is made.
Generally speaking, the appropriate box size is a function of an instrument's price. The BoxSize() function displays the appropriate box size based on the instrument's price:
BoxSize(instrument)=begin i = instrument.last retval = NONUM if i <= 5 then retval = .25 if i > 5 AND i <=20 then retval = .5 if i > 20 AND i <= 100 then retval = 1 if i > 100 AND i <= 200 then retval = 2 if i > 200 then retval = 4 retval end
If an instrument trades between $.01 and $5.00, the appropriate box size is .25.
If an instrument trades between $5 and $20, the appropriate box size is .5.
If an instrument trades between $20 and $100, the appropriate box size is 1.
if an instrument trades between $100 and $200, the appropriate box size is 2.
If an instrument trades over $200, the appropriate box size is 4.
| ||||||||
|
Color |
Enables you to adjust the colors of the Point & Figure Xs and Os.
| ||||||||
|
Method |
Defines the method of the plot.
| ||||||||
|
Reversal |
Enables you define the Reversal amount of the Point & Figure plot.
The reversal amount is the number of "boxes" required for reversal. A smaller reversal gives more frequent reversal signals. Increasing the reversal amount eliminates minor trends. |
©2008 Aspen Research Group, Ltd. All rights reserved. Terms of Use.