|
|
|
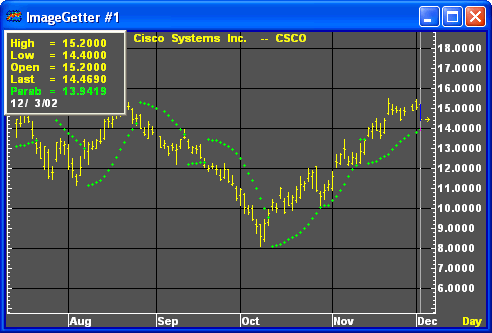
The parabolic study is a "true reversal" indicator in that it is always in the market. Whenever a position is closed-out, it is also reversed. The point at which a position is reversed is called a Stop and Reverse (SAR). Although "stops" are plotted for each bar, a trade is reversed only when the SAR is penetrated by a price.

Formula:

Where:
SARt+1 = next periodís SAR
SARt = current SAR
AF = begins at .02 and increases by .02 to
a maximum of .20
EPtrade = extreme price (high if long; low if short)
The initial SAR or SIP (SAR Initial Point) of a long move is found by looking for the first bar with a higher high and a higher low than the previous bar. The converse of this is used to find the SIP for a short move. The acceleration factor changes as the trade progresses, starting at .02 and increasing in increments of .02 for each bar in which a new extreme occurs.

|
Parameter |
Function | ||||||||||||||
|
Color |
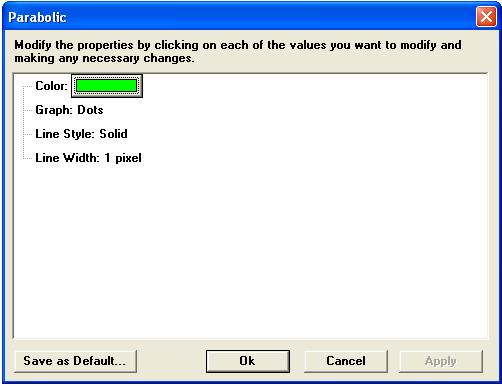
Default color is green. To change the color, click on the color button:
Then choose the color you want from the Color Menu.
| ||||||||||||||
|
Graph |
Sets the drawing method for the study. Default is Dots.
| ||||||||||||||
|
Line Style |
Sets the rendering technique of the graph parameter (if it is set to Line).
| ||||||||||||||
|
Line Width |
Sets the tickness of the study line.
|
Notes
The Parabolic System, a.k.a. Stop and Reverse (SAR), is was created by J. Welles Wilder Jr.
The Parabolic system is different to almost all technical trend following systems in that it is a function not only of price change but also of time. Once a position is assumed, long or short, the Parabolic generates SARs based on market acceleration. If the market has leveled out, the Parabolic increments SARs only slightly, giving the market time to establish a new trend. The Stop may at intervals stand still as the trend consolidates, but the Stop never backs up or reverses. After a specified time has elapsed (ten new price highs in bull markets or ten new lows in bear markets) the progression of the Stop becomes a function only of price.
When the Stop is triggered it was originally intended to be an automatic reverse trade. However, the SAR is a trend following system and in a range market the whipsaws can be murderous. So Wilder later qualified the use of SAR signals with his ADX system so that only SAR signals in the direction of the trend should be taken to open positions. Closure of positions by the SAR are not to be taken as entry of reverse trades. Because of the importance of correlating the SAR signals with the appropriate market environment as indicated by the ADX, you may want to study the Average Directional Index (ADX).
To understand Parabolic mechanics of you must accept that a previous trend has reversed by the triggering of an appropriate SAR point. Once this has occurred we are now in a trade. The first SAR is the extreme point reached in the previous trend, i.e. if we've just gone long the initial Stop is the extreme low of the previous down trend shortly before we were signalled to go long; if we've just gone short then the initial Stop is the extreme high of the previous up trend shortly before we were signalled to go short. We will abbreviate this initial Stop point using Wilder's notation and call it SIP. Once the trade has been opened and the SIP established the SAR for each time period (week, day, hour or whatever time frame you are working in) is calculated as follows:
If Long
For each time period take the difference of
the high of the period and the SAR for the period (so for time period
2, e.g. day 2 - take the difference of the high for day 2 from the SIP)
and multiply this number by Wilder's acceleration factor (AF). This total
is then added to the SAR for the period (i.e. to the SIP for day 2) and
this will give the SAR for the following period (i.e. the SAR for day
3 to continue the example). This can be summarized as
(High of the period - SAR for the period) x AF + SAR for the period
= the SAR for the next period.
e.g. (High of day 2 - SIP) x AF + SIP = SAR after day 2 for day
3
Wilder's acceleration factor (AF) is 0.02 for the initial calculation.
Thereafter the AF is increased 0.02 every period there is a New High made.
If a new high is not made then the AF is not increased from the last SAR.
This continues until the AF reaches 0.2. Once the AF reaches 0.2 it stays
at that value for all future SAR calculations until the trade is stopped
out.
B. If Short:
For each time period take the difference between
the low of the period and the SAR for the period and multiply this number
by the AF and subtract this total from the SAR for the period and this
will be the SAR for the next trading period.
i.e. (Low of the period - SAR for the period) x AF - SAR for the
period = the SAR for the next period.
e.g. (High of day 2 - SIP) x AF - SIP = SAR after day 2 for day
3.
The AF is initially 0.02 and changes by 0.02 intervals until it
is 0.2 but the change in the AF is made only after each New Low of a period
is made. The AF is never increased above 0.2.
Rules of Advancement
The SAR is never advanced into the previous
period's range or the current period's range.
If Long using daily data: Never move tomorrows
applicable SAR above yesterdays or todays low. If the calculated SAP is
higher than either of these lows then use the lower low of these two days
as the SAR and use this value for SAR calculation for the next day.
If Short using daily data: Never move the SAR below the high of yesterday or today. If the calculated SAR is lower than either of these values then use the higher high of these as the SAR for the day and for the future calculation for the following day's SAR.
see, J. Welles Wilder, Jr., New Concepts in Technical Trading Systems, McLeansville, NC: Trend Research, 1978, pp. 9-22.