|
|
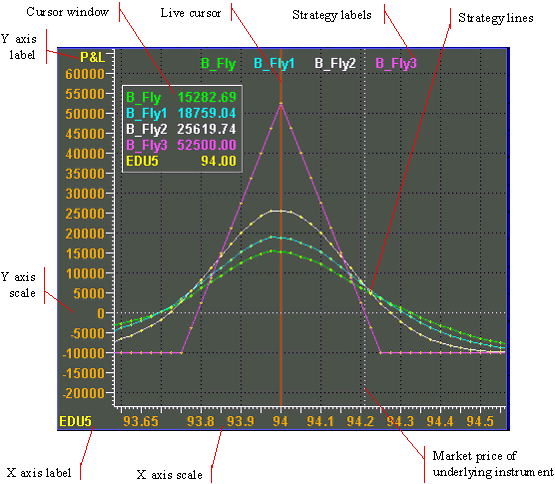
An option chart is an X/Y axis chart. An options chart consists of :

Y Axis
The Y axis ranges from negative values to positive values with a zero line approximately in the middle of the range. The Y axis metric is dependent on the options chart study you display. For more information on Y axis studies, please read Option Chart Studies, page 80. The Y axis can display any of the following studies:
|
Chart Type |
Y Axis Metric |
Label |
|
Profit & Loss Total |
Total profit and loss (Default) |
P&L |
|
Profit & Loss Today |
Daily profit and loss. |
P&Ld |
|
Profit & Loss Market |
Market profit and loss. |
P&Lm |
|
Market Value |
Open trade equity. |
Value |
|
Delta |
Strategy delta |
Delta |
|
Gamma |
Strategy gamma |
Gamma |
|
Theta |
Strategy theta |
Theta |
|
Vega |
Strategy vega |
Vega |
|
Rho |
Strategy rho |
Rho |
|
Frho |
Strategy foreign interest rho |
Frho |
The Y axis label is displayed in the upper left corner of an option chart window (see figure). By default, all option chart windows are P & L, or profit and loss (total). If you change the Y axis, the label changes to identify the selected Y axis metric. For more information on changing the Y axis metric, please read Option Chart Studies, page 80.
X Axis
The X axis shows one of the independent variables of the options pricing model, depending on the study you choose. For more information on X axis studies, please read Option Chart Studies, page 80.
|
Chart Type |
X Axis Metric |
Label |
|
Price |
Underlying price (Default) |
<symbol> |
|
Time |
Time to expiration |
Days |
|
Volatility |
Volatility |
Vlty |
|
Rate |
Interest rate |
Rate |
|
Frate/Yield |
Foreign currency interest rate or stock dividend yield |
Frate/Yield |
An options chart displays the X axis label in the lower left corner. By default, the X axis in all option chart windows show underlying price, so the X axis label is an underlying instrument symbol. If you change the X axis study, the label changes to identify the selected X axis metric. For more information on changing the X axis metric, please read Option Chart Studies, page 80.
Cursor
An options chart's live cursor functions just like a bar chart cursor. The j and l keys move the cursor left and right. You can also hold the left mouse key down and drag the cursor across the chart. Pressing u removes the cursor from the screen.
Cursor Window
The cursor window displays values for each strategy displayed in the options chart.
The live cursor on an options chart is functionally identical to the live cursor in a chart window. Both cause the cursor window to appear and display prices. The values in the cursor window are the prices at the location of the live cursor. Moving the cursor makes prices in the cursor window change.
The prices in a cursor window are strategy line values at the cursor location. The figure above shows a cursor window for an options chart in which a strategy named "bonds" and three slave strategies (see, Slave Strategies, page 73) are displayed.
Strategy Labels
Strategy labels are displayed at the top of the option chart window. A strategy label identifies the name and line color of a each strategy in an options chart. The number of strategy labels is identical to the number of strategies in the options chart. By default, an options chart names strategies using a simple convention. The first strategy is S1, the second is S2, and so on. You can change the name of the strategy in the Strategy Parameters menu. For more information on changing the name of a strategy, please read Strategy Parameters, page 102. If you place an option strategy defined in an option book into an options chart, the chart uses the strategy name as defined in the book.
You can move strategy labels anywhere in the window. To move the label, position the pointer on it, click and hold the right mouse key, and drag it where you want it. If more than one label exists, all labels move together.
You can suppress strategy labels by positioning the mouse pointer on top of the labels and double-clicking the left mouse key. This state is temporary. Re-drawing the options chart causes the labels to return.
Terms
Before you begin reading about using an options chart, please familiarize yourself with some of the terms used in this help module.
Options Chart n. one or more option strategies.
Options Strategy n. an options position. An options position consists of one or more "groups" of options.
Options Group n. one or more options that have the same underlying instrument, and/or the underlying instrument itself.