|
|
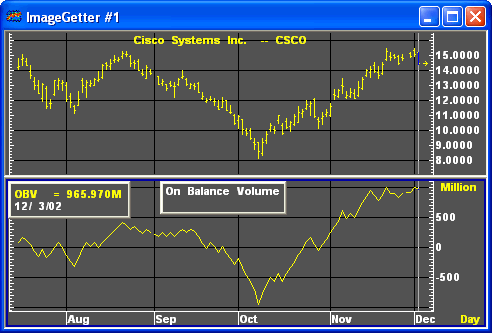
On balance volume is an indicator that attributes volume (tick volume on intraday charts) during up and down trading periods. A close greater than the previous close represents buying. A close lower than the previous period represents selling. The calculation is a simple accumulation process. If a period closes up, its volume is added to the total. If a period closes down, its volume is subtracted from the total.

Formula:

If x is positive, add x to the close.
If x is negative, subtract x from the close.
Where:
Ct-1 = previous close
C = current close
x = volume
The direction of the OBV line is more important than the volume level at any particular point. The OBV line assumes an arbitrary positive integer as a starting point; this ensures a positive OBV value. The OBV follows any market trend, except when a reversal occurs. A divergence is often interpreted as a signal of a trend reversal.

|
Parameter |
Function | ||||||||||||||
|
Color |
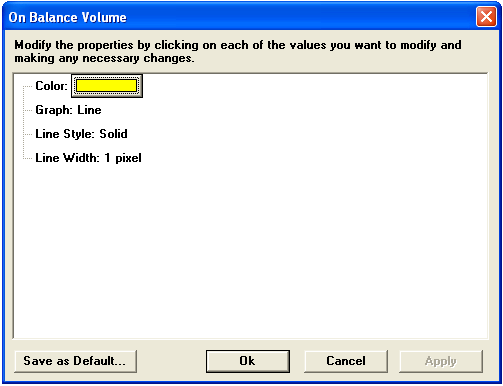
Default color is yellow. To change the color, click on the color button:
Then choose the color you want from the Color Menu.
| ||||||||||||||
|
Graph |
Sets the drawing method for the study.
| ||||||||||||||
|
Line Style |
Sets the rendering technique of the graph parameter (if it is set to Line).
| ||||||||||||||
|
Line Width |
Sets the tickness of the study line.
|
Notes
Joe Granville introduced the On Balance Volume (OBV) indicator in his 1963 book, Granville's New Key to Stock Market Profits. OBV was among the first, if not most popular, indicators to measure positive and negative volume flow. Volume precedes price is the principle behind OBV. A simple indicator, OBV adds a period's volume when the close is up and subtracts the period's volume when the close is down. A cumulative total of the volume additions and subtractions forms the OBV line.
Compare the OBV to the price action of an instrument to identify divergence.
see, John J. Murphy, Technical Analysis of the Futures Markets, A Comprehensive Guide to Trading Methods and Applications, New York: New York Institute of Finance, A Prentice-Hall Company, 1986, pp. 185-189; see also, Joseph Granville, Granville’s New Key to Stock Market Profits, Englewood Cliffs, NJ: Prentice Hall, 1963.