|
|
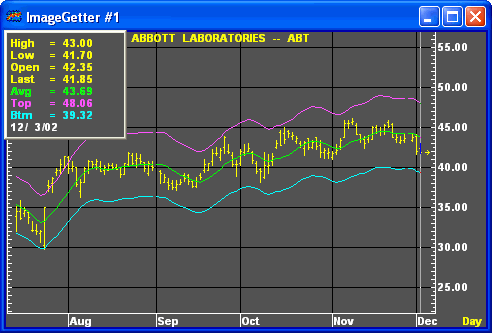
A moving average band, or envelope, forms a channel or zone of commitment around a moving average. A moving average is calculated first, and then a band above and below the average is calculated.

Formula:
Upper Band:

Where:
UB = upper band
MAt = current moving average value
U% = upper percentage value
And:
Lower Band:

Where:
LB = lower band
MAt = current moving average value
L% = lower percentage value
The moving average in a moving average envelope can be calculated using any of the moving averages.

|
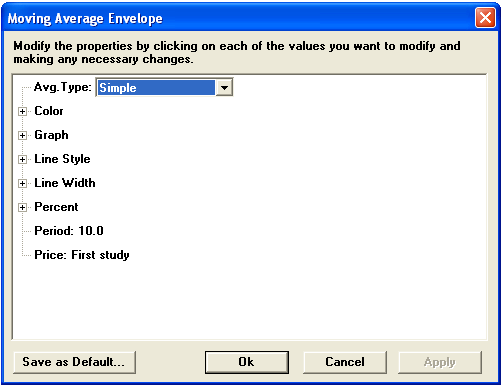
Parameter |
Function | ||||||||||||||||||
|
Avg. Type |
Sets the type of calculation for the moving average:
| ||||||||||||||||||
|
Color |
The defalt color of the center line is green; lower envelope line default is cyan; upper line default is violet. To change the color, click on the color button:
Then choose the color you want from the Color Menu.
| ||||||||||||||||||
|
Graph |
Sets the drawing method for the study.
| ||||||||||||||||||
|
Line Style |
Sets the rendering technique of the graph parameter (if it is set to Line).
| ||||||||||||||||||
|
Line Width |
Sets the tickness of the study line.
| ||||||||||||||||||
|
Percent |
| ||||||||||||||||||
|
Period |
| ||||||||||||||||||
|
Price |
The price on which the study is calculated:
|
Notes
The Moving Average Envelope overlay is a member of the "envelope" class of studies. Envelopes consist of three lines, a center line and two outer bands. Envelope theory holds that price has the greatest probability of falling within the boundaries of the envelope. Prices falling outside the envelope boundaries are considered anomolies. The major differences between envelope types can be found in the calculation of the lines, in the spacing between the lines or bandwidth, and how they are interpreted.