![]()
![]()
|
|
|
|
Momentum is generally thought of as the difference between prices. A momentum study is calculated by subtracting a previous price from the current price. If the previous price is greater than the current price, the study yields a negative value; conversely, if the previous price is less than the current price, the difference is a positive value.
Formula:

Where:
MOM = current momentum value
Pt = current price
Pt-n = price n periods ago
You define the previous price used to calculate the momentum by setting the Periods field in the Moving Average Momentum parameters menu.
Momentum studies are to indicate the rate of change in prices, trends, and price extremes. High positive and negative values are commonly interpreted as overbought and oversold conditions, respectively.
|
Parameter |
Function | ||||||||||||||||||
|
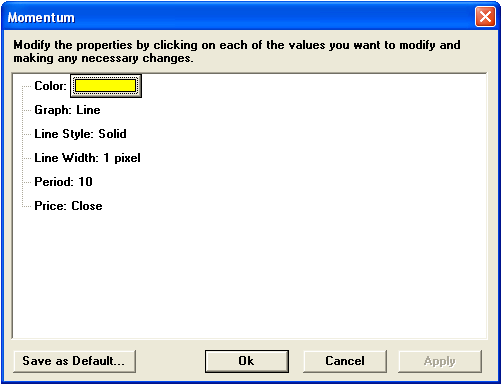
Color |
Default color is yellow. To change the color, click on the color button:
Then choose the color you want from the Color Menu.
| ||||||||||||||||||
|
Graph |
Sets the drawing method for the study.
| ||||||||||||||||||
|
Line Style |
Sets the rendering technique of the graph parameter (if it is set to Line).
| ||||||||||||||||||
|
Line Width |
Sets the tickness of the study line.
| ||||||||||||||||||
|
Period |
Default is 10 | ||||||||||||||||||
|
Price |
The price on which the study is calculated:
|
see, Kaufman, P. J., The New Commodity Trading Systems and Methods, New York: John Wiley & Sons, 1987.

