|
|
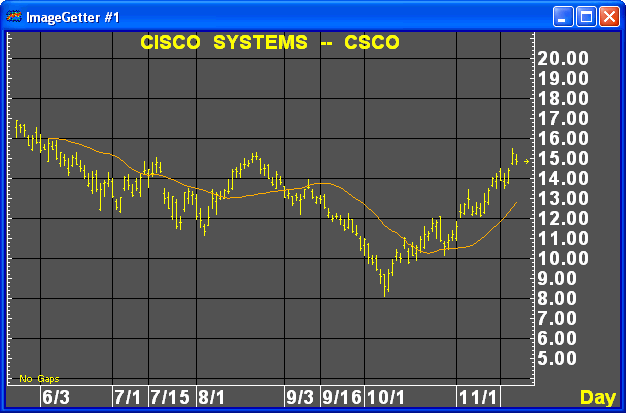
Next, take a look at the MESA Trend study. This study provides confirmation of cyclic activity or evidence of trending, and should correspond to indications from the spectrum study.

For predictive purposes, MESA models price activity as a trend plus a sine wave, the dominant cycle. The MESA Trend line shows that trend, that is, what’s left once the dominant cycle and all other cyclic components detected by MESA have been filtered out of price activity.
MESA Trend offers a test for cycling or trending conditions in the market which is often clearer than indications from the spectrum study. Because MESA models market activity as a trend plus a cycle, the prices should cycle up and down across the trend line over time. Even if the other studies seem to indicate cycling activity, if the price bars don’t cross, or at least touch, the trend line within one half-cycle of the dominant cycle, this is a strong indication that a trending mode is beginning.
For instance, if the dominant cycle’s wavelength is 18 bars, count back 9 bars from the current bar. If the price bars have not crossed the MESA Trend line between the ninth bar back and the current bar, then this is a strong indication that the market is not in fact cycling. This kind of phenomenon corresponds to, for instance, a "rising tail" in the MESA Spectrum sub window, but may in fact be visible earlier than a rising tail.
On the other hand, if the price bars have crossed or at least touched the trend line within one half of the dominant cycle’s wavelength, or have crossed and re-crossed the line over a longer period, this confirms other evidence of cycling in the market. If the price bars touch or preferably cross the trend line after a period of trending, this evidence that the market is shifting from a trending mode to a cycling one.
Determining Questions for MESA Trend
Do the price bars cross or at least touch the
MESA Trend line within half of the dominant cycle’s wavelength? If
not, this is a sign that regardless of the indications of MESA Phase and
MESA Spectrum, the market is probably not in a cycling mode, but is in
a trending mode. In
this case, trending trading opportunities should be pursued.
If price bars do cross the trend line, the market is probably in a cycling mode. If they cross or touch it after not crossing or touching it for some time, this is an indication that the market may be switching from a trending mode to a cycling mode, raising the likelihood of spotting trading opportunities through MESA.
Parameters
The MESA Trend study draws the trend line used in MESA cycle analysis.
The price is modeled as the simple addition of a trend plus a single cycle. The MESA study measures the dominant cycle. The cyclic component of the model is completely removed by taking a simple average over the period of the dominant cycle, leaving the trend component as the residual. The process is repeated for each bar to compute the MESA trend.
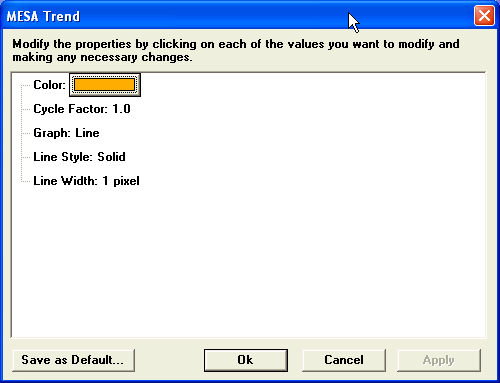
The MESA Trend study has three adjustable parameters, cycle factor, color, and graph type:
