|
|
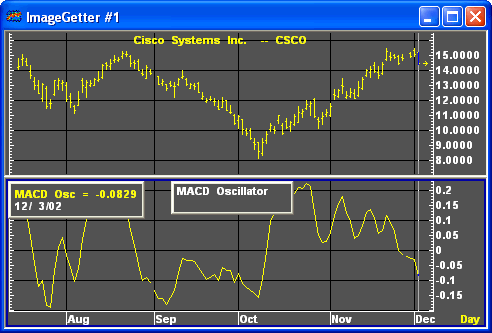
The MACD oscillator converts the two lines of the MACD into a single line that fluctuates above and below zero. The MACD oscillator is calculated by subtracting the signal line value from the MACD line value. When the MACD line crosses the signal line, a buy or sell signal is generated. The signals provided by the MACD or the MACD oscillator are identical. The choice of one over the other is simply a matter of user preference.

For more information on the formula used to calculate the MACD oscillator, see Moving Average Convergence Divergence (MACD).

|
Parameter |
Function | ||||||||||||||||||
|
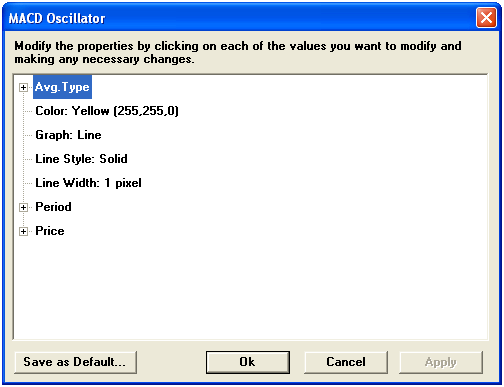
Avg. Type |
Sets the type of calculation for the for Average 1, Average 2 and the Signal Line:
| ||||||||||||||||||
|
Color |
Default color for the MACD Line is green. Default color for the Signal Line is yellow. To change the color, click on the color button:
Then choose the color you want from the Color Menu.
| ||||||||||||||||||
|
Graph |
Sets the drawing method for the study.
| ||||||||||||||||||
|
Line Style |
Sets the rendering technique of the graph parameter (if it is set to Line).
| ||||||||||||||||||
|
Line Width |
Sets the tickness of the study line.
| ||||||||||||||||||
|
Period |
Default for Avg. 1 is 0.1 Default for Avg. 2 is 0.2 Default for Avg. 3 is 0.3 | ||||||||||||||||||
|
Price |
The price on which Average 1 and 2 are calculated:
|
Notes
See, notes on the MACD.
see, Appel, Gerald, The Moving Average Convergence-Divergence Trading Method, New York: Signalert Corporation.