|
|
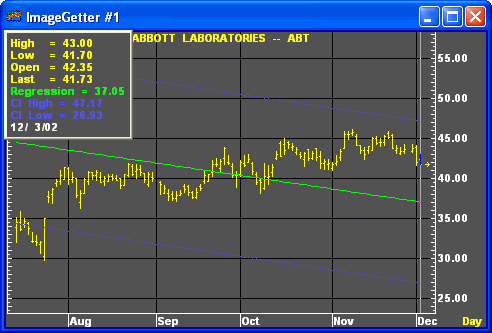
Linear regression is a straight-line representation of two sets of data. Aspen arrives at the necessary data sets by pairing today's price over time.

The following section explains how Aspen calculates Linear Regression:
Y = a + bX
where
Y is a price
X is time
b is the “Y intercept”, or the point at which the line crosses the Y axis, or

a is the slope, or angle of the line
and
N is the number of data points and  represents the sum
over N points.
Linear regression uses the “best fit” technique to draw a straight line that is closest to most of the data points. The most popular technique in statistics for “best fit” determination is the method of least squares. The best fit is the straight line from which all actual data points vary least.

where
 implies
S is the sum of the squares of the error of each of the data sets
 is the difference between
the actual value of yi at xi
The line that causes S to be
the smallest value possible is the best fit. The square of  is always positive, which magnifies the importance of data
points far away from the best fit line and reduces the importance of data
points that are close.
Aspen’s Linear Regression also plots confidence lines above and below the best fit line.

|
Parameter |
Function | ||||||||||||||||||
|
CI Regression |
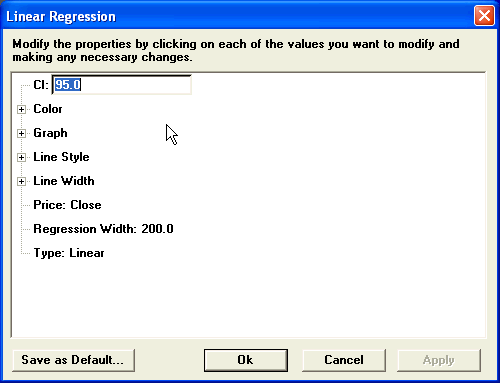
The Cl, or confidence level, regression default is 95%, which means there’s a 95% chance the real price falls between the confidence lines.
| ||||||||||||||||||
|
Color |
Default color of the center line is green; channel lines default to blue. To change the color, click on the color button:
Then choose the color you want from the Color Menu.
| ||||||||||||||||||
|
Graph |
Sets the drawing method for the study.
| ||||||||||||||||||
|
Line Style |
Sets the rendering technique of the graph parameter (if it is set to Line).
| ||||||||||||||||||
|
Line Width |
Sets the tickness of the study line.
| ||||||||||||||||||
|
Price |
The price on which the study is calculated:
| ||||||||||||||||||
|
Regression Width |
Sets the number of bars in the regression.
| ||||||||||||||||||
|
Type |
The Type parameter enables you to view the regression on the price, or linear, scale, or on a logarithmic scale. |
Notes
The Linear Regression overlay is a member of the "envelope" class of studies. Envelopes consist of three lines, a center line and two outer bands. Envelope theory holds that price has the greatest probability of falling within the boundaries of the envelope. Prices falling outside the envelope boundaries are considered anomolies. The major differences between envelope types can be found in the calculation of the lines, in the spacing between the lines or bandwidth, and how they are interpreted.
Linear Regression can be defined as the drawing of an unknown line using the values of known, correlated variables. The dictionary meaning of regression is "to go backward." Correlation gives magnitude and direction between correlated variables. (Correlation does not imply causation; the fact that the variables x and y are correlated does not necessarily mean that x causes y or vice versa.)
In a chart, prices are highly correlated. Using prices, Linear Regression draws a straight line such that all the prices are close. This line is called the line of best fit. Bands, or channel lines, are drawn a fixed distance above and below the best fit line.
|
|
|
©2008 Aspen Research Group, Ltd. All rights reserved. Terms of Use.