|
|
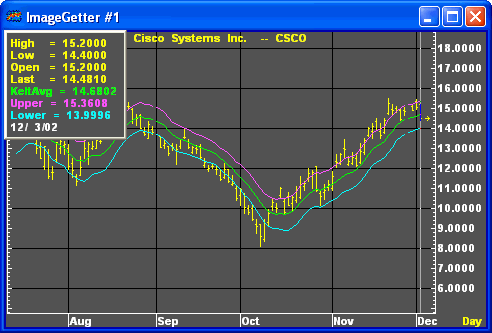
Keltner channels help you identify market trends. Keltner channels compare today’s prices with yesterday’s prices. An absence of new highs indicates a downtrend. An absence of new lows indicates an up trend. In conjunction with this method of trend identification, the Minor-Trend Rule is used. The Minor Trend Rule states that the minor trend is bullish if the daily trend sells above its most recent high: conversely, the minor trend is bearish if the daily trend sells below its most recent low.

A Keltner channel study consists of a moving average and two channel lines. The channel lines are drawn by adding to and subtracting from the current moving average value the product of a constant multiplied by the average true range of each bar.
Formula:
Center Line:

Where:
CL = center line
EAVG = exponential moving average
n = number of bars
P = price
And:
Average True Range:

Where:
ATR = average true range
R = range
n = number of bars
H = high
L = low
And:
Upper Channel Line:

Where:
UP = upper channel value
CL = center line
ATR = average true range
C = constant
And:
Lower Channel Line:

Where:
DN = lower channel value
CL = center line
ATR = average true range
C = constant

|
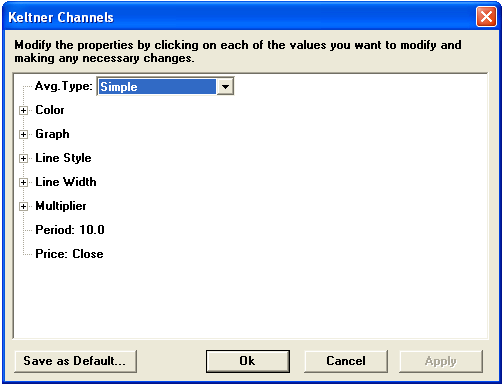
Parameter |
Function | ||||||||||||||||||
|
Avg. Type |
Sets the type of calculation for the moving average:
| ||||||||||||||||||
|
Color |
Default color for the center line is green; lower channel defaults to cyan; upper channel defaults to violet. To change the color, click on the color button:
Then choose the color you want from the Color Menu.
| ||||||||||||||||||
|
Graph |
Sets the drawing method for the study.
| ||||||||||||||||||
|
Line Style |
Sets the rendering technique of the graph parameter (if it is set to Line).
| ||||||||||||||||||
|
Line Width |
Sets the tickness of the study line.
| ||||||||||||||||||
|
Multiplier |
| ||||||||||||||||||
|
Period |
| ||||||||||||||||||
|
Price |
The price on which the study is calculated:
|
Notes
The Keltner channel technique, which was first presented in 1960, is not generally as well known as other channel methods.
The Keltner Channels overlay is a member of the "envelope" class of studies. Envelopes consist of three lines, a center line and two outer bands. Envelope theory holds that price has the greatest probability of falling within the boundaries of the envelope. Prices falling outside the envelope boundaries are considered anomolies. The major differences between envelope types can be found in the calculation of the lines, in the spacing between the lines or bandwidth, and how they are interpreted.
see, Chester W. Keltner, How to Make Money in Commodities, Kansas City, MO: The Keltner Statistical Service, 1960; see also, Perry J. Kaufman, The New Commodity Trading Systems and Methods, New York: John Wiley & Sons, 1987.