|
|
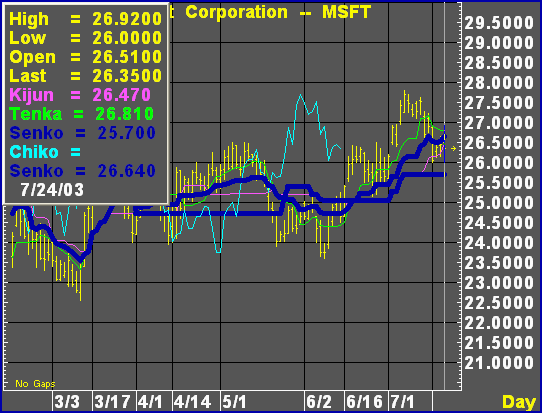
Ichomoku Kinko Hyo is a Japanese charting technique developed by a Japanese journalist who wrote under the name "Ichimoku Sanjin" prior to World War II. This study shows where a market is headed and provides entry and exit points.
Ichimoku means "glance", Kinko translates "balance" or "equalibrium", and Hyo is Japanese for "chart".
Ichimoku Kinko Hyo consists of the following lines:
Tenkan Sen is the conversion line.
Kijun Sen is the base line.
Chikou Span is the lagging span.
Senkou Span 1 is the first leading span.
Senkou Span 2 is the second leading span.
The Kumo, or Cloud, is the area between Senkou Span 1 and Senkou Span 2.

Ichimoku analysis is similar to Moving Average analysis. Buy and sell signals are given by cross-overs. A bullish signal is issued when the Tenkan Sen crosses Kijun Sen from below. Conversely, a bearish signal is given when Tenkan Sen crosses Kijun Sen from above.
Ichimoku rates the strength of bullish and bearish cross overs, too. A bullish crossover signal that occurs above the Kumo is a very strong signal. Similarly, a bearish cross over below the Kumo is considered strong.
The Kumo indicate support and resistance levels.
©2008 Aspen Research Group, Ltd. All rights reserved. Terms of Use.