|
|
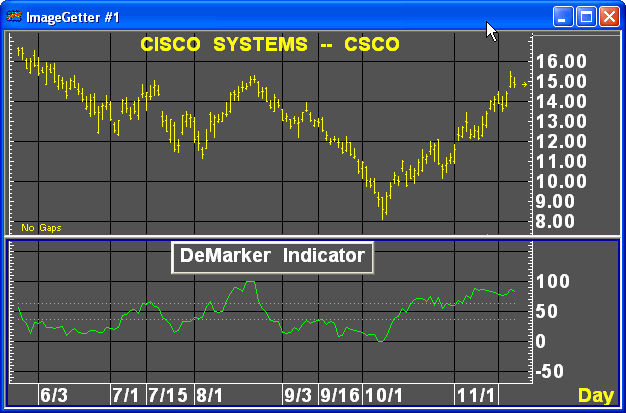
The DeMarker Indicator identifies potential price bottoms and tops. It accomplishes this by making price comparisons from one bar to the next and measuring the level of price demand.

For further information on the DeMarker Indicator, please refer to Thomas R. DeMark, The New Science of Technical Analysis, New York: John Wiley & Sons, 1994, Chapter 3, Overbought/Oversold.
Parameters
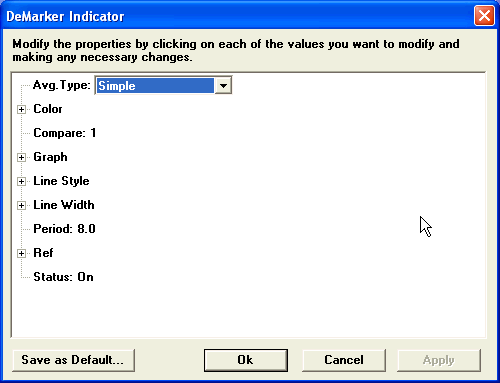
This study draws a graph of DMI values, which fluctuate between 0 and 100. Optionally, dotted reference lines can be drawn at user-set values, but these lines do not affect the calculation or display of the DMI line itself.

The DMI computes two values at any given bar:
DMIHigh = Max(High-High[K bars ago],0)
DMILow = Max(Low[K bars ago]-Low,0)
The final DMI study value is then computed as an N-bar moving average of DMI High, divided by an N-bar moving average of (DMIHigh+DMILow), and multiplied by 100 to give a result in the desired range. The type and length of the moving averages are selectable.