|
|
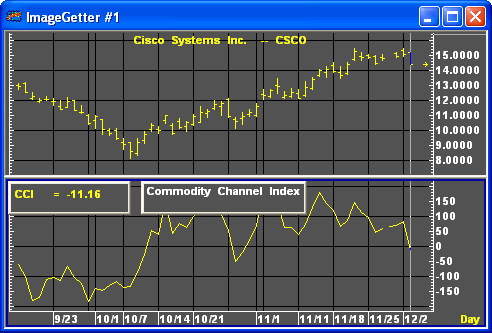
The Commodity Channel Index is an indicator designed for use in markets that follow definite cyclical patterns.

While the CCI does not determine cycle lengths, if you have an idea of cycle length, the CCI can be a valuable timing tool.
Formula:

Where:
n =number of periods
TPt =the current typical price:
MAt =current simple moving average
MD =mean deviation
Pn =price
Donald R. Lambert, who originated the CCI, suggests using a number of periods less than one-third of the cycle length. Using this calculation, seventy to eighty percent of random price fluctuations should fall within the +100% to -100% range. If the CCI yields a value above +100%, a long position may be indicated. When the CCI value falls below +100%, closing a long position should be considered.
Short positions may be interpreted using the converse of this technique at the -100% level.

|
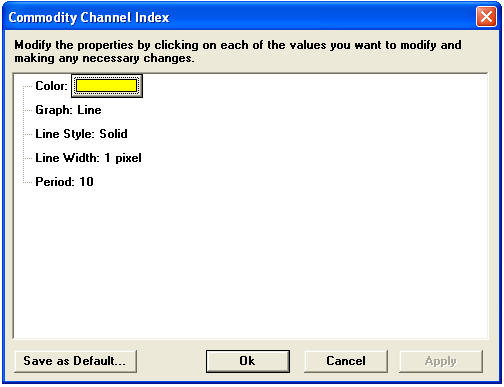
Parameter |
Function | ||||||||||||||
|
Color |
Default color is Yellow. To change the color, click on the color button:
Then choose the color you want from the Color Menu.
| ||||||||||||||
|
Graph |
Sets the drawing method for the study.
| ||||||||||||||
|
Line Style |
Sets the rendering technique of the graph parameter (if it is set to Line).
| ||||||||||||||
|
Line Width |
Sets the tickness of the study line.
| ||||||||||||||
|
Period |
Default is 10 |
Notes
Developed by Donald Lambert, the Commodity Channel Index (CCI) was designed to identify commodity cycles. CCI is a leading indicator. The assumption of the CCI is that commodities (and other instruments) move in cycles--that is, highs and lows occur at regular intervals. Given this assumption, Lambert recommended setting the number of periods to a third of the cycle length. In other words, if a cycle, low to low or high to high, is 90 days, the number of periods should be 30.
Lambert defined buy and sell signals as movements above +100 and below -100, respectively, which makes the CCI a banded oscillator. A move over +100 is considered a bullish signal. Conversely, a move under -100 is a bearish signal.
The CCI can also be used to identify overbought and oversold levels. An instrument is deemed oversold when the CCI dips below -100, and overbought when it exceeds +100.
Traders and investors also use the CCI to help identify price reversals, price extremes, and trend strength. As with all studies, signals given by the CCI should be confirmed by other technical indicators.
see, D. R. Lambert, "Commodity Channel Index: Tool for Trading Cyclic Trends," Commodities [now Futures] Magazine, October, 1980, pp. 40-41.