|
|
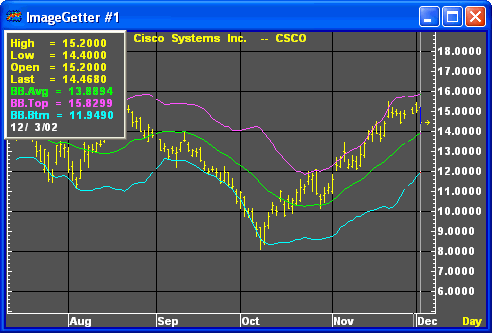
Bollinger bands are lines drawn at a fixed interval around a moving average as a function of a marketís volatility. The lines, or Bollinger Bands, are plotted above and below the chosen moving average at a distance equal to two times the root mean square of the deviations, or Standard Deviation, from the moving average. The length of the data used in the equations is equal to the length of the simple moving average employed.

Standard Deviation is a method of measuring the volatility or dispersion of a data series. To calculate Standard Deviation, you need a data series and a constant number of periods. First, you add the values of the data points in the data series. Then, proceed with the following steps:
Divide the sum by the number of data points, or Periods. The quotient is the Arithmetic Mean.
Subtract the Arithmetic Mean from each data point. The results are the Raw Deviations.
Square each Raw Deviation. The products are the Squared Deviations. (Squared Deviations eliminate negative numbers.)
Add the Squared Deviations. The sum is the Total Squared Deviation.
Divide the Total Squared Deviation by the number of data points, or Periods. The quotient is the Mean Squared Deviation.
Calculate the square root of the Mean Squared Deviation.
The result is the Standard Deviation.
Formula:


Where:
SD = standard deviation
TSD = total squared deviation
MSD = mean squared deviation
D = raw deviation
D2 = squared deviation
AM = arithmetic mean
P = number of periods
DP = data point

|
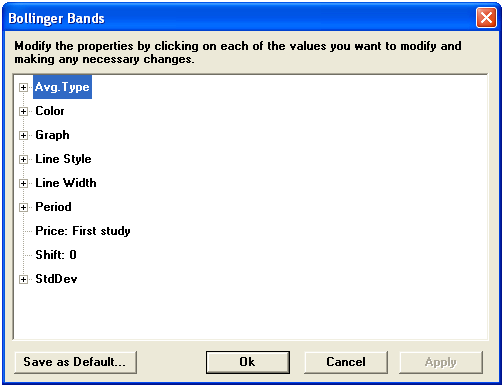
Parameter |
Function | ||||||||||||||||||
|
Avg. Type |
Sets the type of calculation for the moving average:
| ||||||||||||||||||
|
Color |
Default color for the center line is yellow; lower channel defaults to cyan; upper channel defaults to violet. To change the color, click on the color button:
Then choose the color you want from the Color Menu.
| ||||||||||||||||||
|
Graph |
Sets the drawing method for the study.
| ||||||||||||||||||
|
Line Style |
Sets the rendering technique of the graph parameter (if it is set to Line).
| ||||||||||||||||||
|
Line Width |
Sets the tickness of the study line.
| ||||||||||||||||||
|
Period |
| ||||||||||||||||||
|
Price |
The price on which the study is calculated:
| ||||||||||||||||||
|
Shift |
| ||||||||||||||||||
|
StdDev |
|
Notes
Developed by John Bollinger, Bollinger Bands compare volatility to price over time. The overlay consists of three bands.
A moving average center line
An upper band (SMA plus n standard deviations)
A lower band (SMA minus n standard deviations)
The upper and lower bands balloon during periods of erratic price change and narrow during periods of low volatility.
The Bollinger Bands overlay is a member of the "envelope" class of studies. Envelopes consist of three lines, a center line and two outer bands. Envelope theory holds that price has the greatest probability of falling within the boundaries of the envelope. Prices falling outside the envelope boundaries are considered anomolies. The major differences between envelope types can be found in the calculation of the lines, in the spacing between the lines or bandwidth, and how they are interpreted.
Bollinger recommended using a 20-day simple moving average for the center band and 2 standard deviations for the outer bands. The length of the moving average and number of deviations can be adjusted in Aspen.
A bullish signal is given when prices penetrate the lower band and remain above the lower band after a subsequent low forms. Similarly, a bearish signal is given when prices peak above the upper band and a subsequent peak fails to break above the upper band.
Sharp price changes can occur after the bands have tightened, but Bollinger Bands do not give forecast trend. Market direction must be determined using other types of analysis. Use Bollinger Bands to identify the market volatility and price extremes.
see, Bollinger, John, Capital Growth Letter.