![]()
![]()
|
|
|
|
A bar chart is the most popular form of charting and is, therefore, the default chart type.
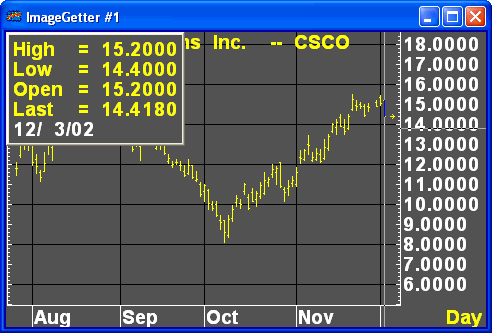
When an instrument is charted, it is initially displayed as a bar chart. (For information on how bars are built, please read How Aspen Graphics Builds Bars.)
As time progresses, a vertical bar is drawn on the chart. The top of this bar marks the highest price during that period. The bottom of the bar marks the lowest price during that period. The opening price for the period is shown by a horizontal hash mark extending to the left of the bar, and the close is marked by a similar hash mark extending to the right of the bar.
You can display an arrow that floats along the price scale to indicate the current price. To do this, insert the PRICEARROW=ON line in your SETUP.TXT file.