|
|
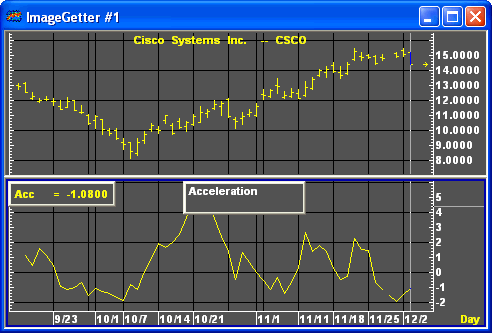
An acceleration study identifies the rate of change in momentum.

A momentum study indicates the rate at which prices change; an acceleration study indicates the rate of change in momentum. When an acceleration study yields a positive value, prices are not only rising, they are also rising at a faster rate. Conversely, when an acceleration study yields a negative value, prices are falling at a faster rate.
Formula:

Where:
ACC = current acceleration value
MOMt = current momentum value
MOMt-n = momentum value n periods ago

|
Parameter |
Function | ||||||||||||||||||
|
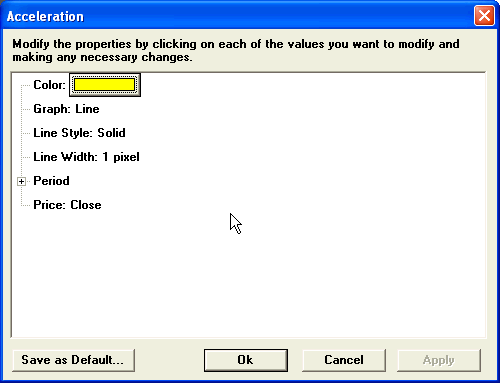
Color |
Default color is Yellow. To change the color, click on the color button:
Then choose the color you want from the Color Menu.
| ||||||||||||||||||
|
Graph |
Sets the drawing method for the study.
| ||||||||||||||||||
|
Line Style |
Sets the rendering technique of the graph parameter (if it is set to Line).
| ||||||||||||||||||
|
Line Width |
Sets the tickness of the study line.
| ||||||||||||||||||
|
Period |
Two acceleration elements require a number of periods:
| ||||||||||||||||||
|
Price |
The price on which the study is calculated:
|